
 Sure, the general patterns that you have read about are important. But have you thought about the many other things that can come onto a readout?
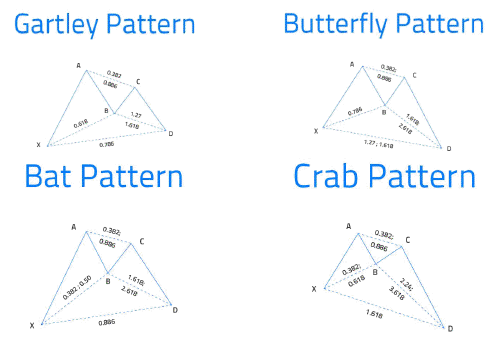
There are many patterns that might be a little more intense or detailed than others. You should be aware of these patterns as they can directly influence the total value of whatever you are trying to invest in. This review would provide you with main patterns that you might need for you trades.
Engulfing Pattern
An engulfing pattern is found at the end of a period of upward or downward pressure that has been found within the market. The high can go well above the high that was found on the prior day during the bullish pattern or below the original low in a bearish pattern. Either way, the bars might look relatively similar to one another for a few trading periods.
This pattern suggests that there is a sense of new strength that is about to get into the market. This in turn could result in some great payouts depending on what happens within the market.
Notice in the example you see here that the chart has a series of days where the trading values appear to be rather consistent with one another. This is a good total that can do more for your investment.
Sometimes the pattern will entail a few days of consistent values followed by one day with a huge change. The chart that you see right here is an example of this.
Piercing Line Pattern
In this pattern, the close on the second bar is more than halfway up or down on the body of the first bar. It is a sign that there might be a reversal to a trend.
Doji
The Doji trend suggests that there is not much of a body on a candlestick. That is, hardly any trading has occurred as the start and close of the pair is near the same. In fact, the trading highs and lows may be relatively close to each other.
This is a sign that the trend that came about earlier might be changing. The currency pair in question may end up changing after a while.
Shooting Star
The shooting star features the value of a pair going up over a day in spite of the initial rise being much higher. That is, the trading has been to the point where the trading was strong enough to where the value of a pair went up rather high but will have gone back down to something closer to where it was at the start of the trading day.
This is more of a bearish symbol. It suggests that the value of a pair may not go up all that much and that people have their limits as to what they are willing to get out of the pair.
Inverted Hammer
The inverted hammer is the opposite of the shooting star. The value goes down on a pair in an intense manner but it will go back up during the trading day to where it will be near the original open. This is a bullish sign of what can happen with a pair and can easily influence what may happen with it.
Morning Star Pattern
The morning star pattern is a bullish pattern that suggests that the value of a pair is about to reach the bottom. It has three different candlesticks:
- One stick is a longer one that goes down
- A shorter stick is next
- A longer one will then go over the middle part of the first one, usually suggesting that the value is about to go up for a few days
Evening Star Pattern
The evening star pattern is a bearish one that is essentially the opposite of a morning star. It suggests that the top has been reached and that the value of a pair is not going to change all that much after a while.
Outside Bar Break Up and Down
The outside bars on a chart will identify trends that you can follow for weeks or months – maybe years? – to come. A break up or down can be important to spot out here.
- A break up occurs when the values start to go over the bars.
- A break down occurs when the values go below those bars.
This can last for a few days and can symbolize when a trend is about to change.
Elliott Wave Theory
The Elliott Wave theory suggests that there will be a five-part pattern that will be used to show when particular changes are going to take place. The five waves work with a very specific pattern.
The first, third and fifth waves will go up or down.
The second and fourth waves will go in the opposite direction as the others.
The waves can last for as long as they have to. Also, the second and fourth waves are typically not as strong as the others but they will still be rather noticeable.
Fibonacci Fans and Retracements
Fibonacci fans and retracements are named after the famed mathematician. These are features that can be traced through a typical Forex trading computer program but it helps to at least get a closer look at how they are devised and what makes them so special.
A Fibonacci fan has three diagonal lines. The high and low points on these lines will help to establish a trend line.
The vertical distance between these points is calculated by working with Fibonacci ratios of 38.2, 50 and 61.8%. This is used to identify the key support and resistance levels in a pair.
Retracements work in the same way but they focus more on reversals. Fibonacci fans focus on consistent values instead.
Stochastics
What are stochastics and how do they relate to the trading process? Simply put, stochastics refer to the closing price of a Forex pair when compared with its price range over a certain period of time. This can be rather sensitive but the time period for measuring something can be adjusted to help review how well market movements might impact the total value of something.
Stochastics state that as the market rises in value, the prices will be equal to or over the last closing price. Meanwhile, while the market goes down, the prices will be equal to or less than what the last closing price was.
This helps you to identify when certain market trends are about to end. It helps you see in particular if the market is being oversold or overbought.
When the lines are too high over a running average, it means that the market is being overbought. This means that more people have bought the pair than expected. This in turn makes for an ideal time to sell your currency pair as the chance for the pair to go up in value some more is extremely unlikely.
RSI
The Relative Strength Index, or RSI, is a measurement of when a market is overbought or oversold. That is, more people are buying or selling than expected, thus resulting in a good time to either buy something that is being sold too much or to sell whatever is being bought at an extremely high rate.
The RSI is typically generated by an online trading platform and is in a range from 0 to 100. The total number being used is created by using this calculation:
100 – 100 / (1 + (average number of up closes divided by the average number of down closes)
A reading below 30 on the RSI means that the currency pair is being oversold. A reading over 70 says it is overbought.
It’s good to use the RSI but you have to watch for cases when it’s real far from 50. This is often a sign that the trend is about to change rather quickly.
CCI
The Commodity Channel Index refers to the time period when the price reversal cycle on a transaction is about the take place. The CCI will have to go out of a particular range to determine when something is about to move up or down.
The CCI can be calculated through a trading program. A good platform can help you review the total CCI to give yourself more control over how an analysis is to be run.
MACD
The Moving Average Convergence Divergence measurement will review moving averages that can help to identify cases where bull or bear trends are coming. This shows how many trading periods take place within moving averages by generating a line. This line can also be used within a particular program.
The MACD line has to run with the moving average to show a consistent change in value but it can also go faster or slower. If the moving average appears to be faster or slower according to the line readout then that means more money could be used within a transaction.
The line that you see here is a good example of how this can work. Notice how the trading processes are going outside the moving average. This is often a sign of how certain trends may develop. The MACD line can go below the moving average to suggest that the value of a pair is about to go down. The same can be said for changes that take place the other way around.
Moving Averages
The moving averages that you can see on any chart will certainly be important to review. These are the average closing prices over a series of periods. The moving averages are used to analyze how the value of a pair will change over time.
It can be read in a simple form that entails the closing prices added over time and then divided by the number of periods you have gathered within a range. It can also be read in an exponential form that puts an added weight on certain days, particularly the most recent ones.
The moving average can certainly help you out but it’s important to see that any program you use to trade with will give you averages that are accurate and can help you out with getting a good idea of where the totals are going.